Visualization Features
Tooltips
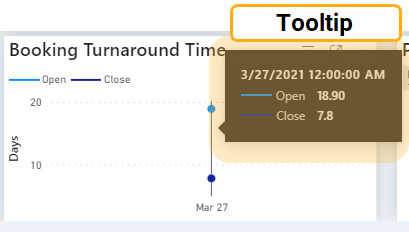
Tooltips provide more detail about functionality as well as data points on a tile. To see a tooltip, hover over a label or data point.
Example:

Visualization Options
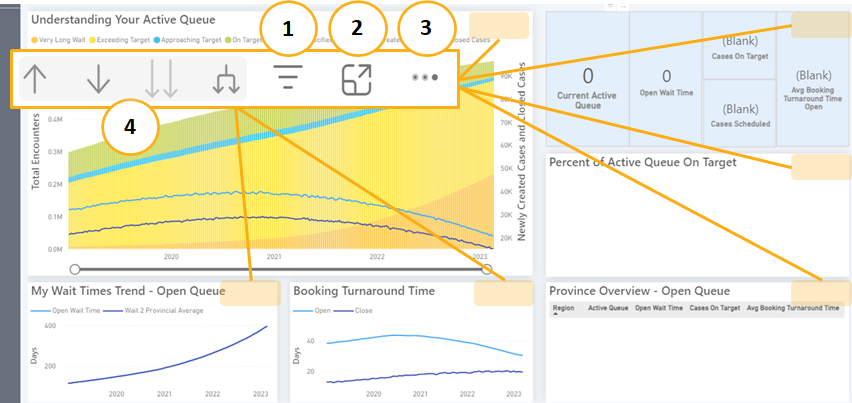
Hovering your mouse over the top right cover of any tile will display visualization options available for that tile:
Note: Tiles may not have all 4 options.

1. Filter on Visual
Filter on Visual lets you see which filters are affecting the data you see in a tile.
- Hover your mouse over the top right corner of a tile, visualization options will display.
- Select the Filter on Visual icon.

- A list of filters and slicers affecting this visual appears.
- To exit, click away from the list.
2. Focus Mode
Focus mode lets you expand (pop out) a tile to see more detail.
- Hover your mouse over top right corner of a tile, visualization options will display.
- Select the Focus Mode icon.

- The tile opens in full screen mode.
- To exit Focus Mode, click the Back to report button.

3. More Options
More Options reveal additional tile options to view and share data.
- Hover your mouse over top right corner of a tile, visualization options will display.
- Select the More options icon.

-
A list of options appears (Note: Not all options are available for each tile):
Export Data
You can export the tile data in .xlsx or .csv format.
Important: As part of the EULA, you agreed not to disseminate, distribute, or copy any data, reports, and information you obtain as a result of your access to the Health System Insights Tool to any parties outside of your organization.
- From the More options menu, select Export Data. The ability to export raw data is turned off.
- Select the file format:
Note: The number of rows you export is limited by the file type you select.- .xlsx (Excel 150,000 - row max)
- .csv (30,000 - row max)
- Click the Export button, messages will display on progress (i.e.,in progress,complete).
Show as a Table
Show as a Table lets you expand (pop out) a tile to see the chart with data displayed in a table.
- From the More options menu, select Show as a table.
- The tile opens in full screen mode. The chart appears followed by a table with the data.
- To exit, select the Back to report button.
Spotlight
Spotlight highlights the tile.
- From the More options menu, select Spotlight.
- The selected tile is highlighted; all the other tiles on the page fade.
- To remove the spotlight, select More Options and select Spotlight again.
Get Insights
This feature is currently not available.
Sort Axis
Enables you to present the chart in different manners by changing the sort axis and sort order.
- From the More options menu, select Sort order.
- Select the desired Sort axis and Sort order.
Sort Legend
Enables you to present the chart in different manners by changing the legend sort order
- More options menu, select Sort legend.
- Select the desired Sort legend and Sort order.
4. Drill Mode
The Drill mode lets you drill into the data.
- Hover your mouse over the top right corner of a tile, visualization options will display.
- If available, select from the following icons:

How to Print
Currently you need to use your browser's default print functionality.
Tip: Using the Show as a Table option may provide the best version of the tile for printing.