Avg. Wait Time vs Peers
The graph represents the Wait 2 days vs open cased per facility. The graph is based on currently Active Cases within the Region.
The Horizontal axis represents the Volume of Wait 2 days Average for the Active Cases within the current period. The Vertical axis represents the Active Cases for the selected Time Range.
- The result can be filtered by Region, Facility, Service Detail, Service Details 2, Priority Level, Age, Timed Procedure, Combination Scan, Clinical Indication for Scan, and Patient Type.
- Selection of any data point on this chart will not be reflected on all other charts within the page
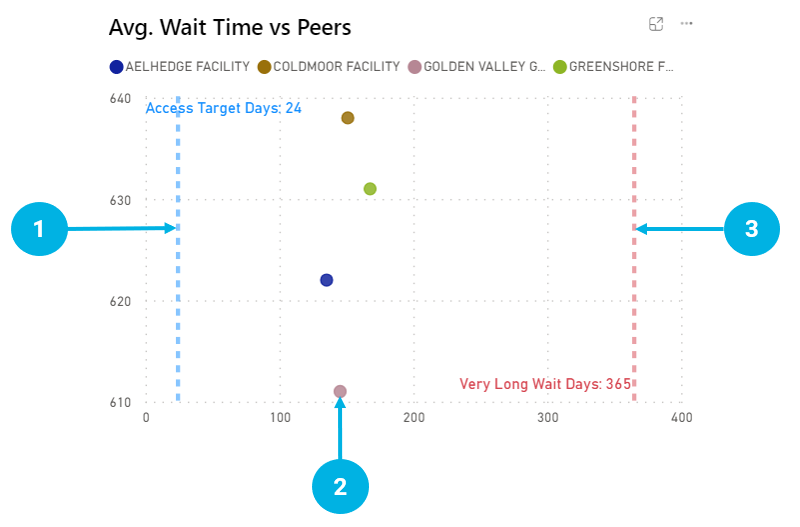
Active Wait 2 Time vs Peers - Data Points
|
Data Point |
Definition |
Methodology |
|
1 |
Access Target Date Average |
Avg of Wait 2 days for all Procedure/Priorities in the Active Queue |
|
2 |
The Horizontal position of the dot represents the Avg of Wait 2 Time of Active Cases for the Facility, The vertical position of the dot represents the Volume of Cases in the Active Queue for the Facility. The color of the dot represents the Facility |
Avg of Wait 2 days in the Active Queue for the Facility |
|
3 |
Very Long Wait Average |
Avg of Very long Waits for all Procedure/Priorities in the Active Queue |