Open Queue Year over Year
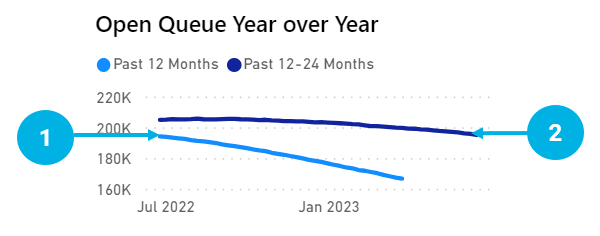
The Graph presents the Volume of Active Cases in the past 12 months vs the Volume of Active Cases in the same period within 12 months before that.
- The result can be filtered by Region, Facility, Service Detail, Service Details 2, Priority Level, Age, Timed Procedure, Combination Scan, Clinical Indication for Scan, and Patient Type.
- Selections on this visual do not interact with any other visuals on the page.

Open Queue Year over Year - Data Points
|
Data Point |
Definition |
Methodology |
|
1 |
The line represents the volume of Cases with an Open Status for the last 12 months |
The volume of Cases with an Open Status for the last 12 months (Open Queue) |
|
2 |
The line represents the volume of Cases with an Open Status for the same period for the 12 months before that |
The volume of Cases with an Open Status for the same period for the 12 months before that |