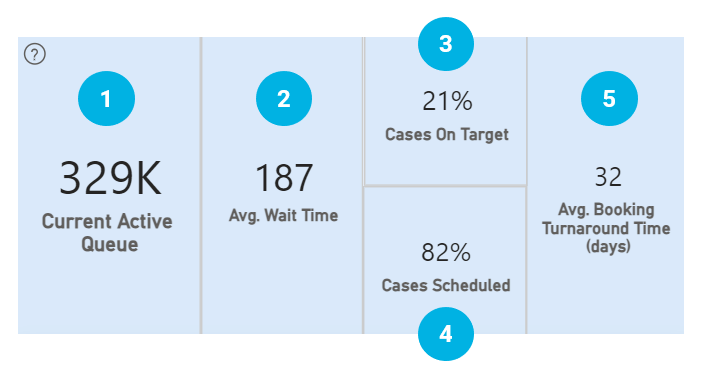
Current Active Queue
The graph gives information about all currently Active Cases. It’s a static card and will not be affected by filter selection.

Current Active Queue – Data Points
|
Data Point |
Definition |
Methodology |
|
1 |
Volume of Active Cases in the current period |
∑ of Waitlist Entries in Open status (Active Cases) from the previous week + newly open Cases by Decision to Treat Date |
|
2 |
Average Wait 2 days Average for Active Cases |
Avg of Wait 2 days in the Active Queue |
|
3 |
% Of Active Cases with the Wait 2 time on or below the Wait 2 Time Access Target |
% Of Cases with the Wait 2 Times days below the Access Target for the Procedure/Priority level combination in the Active Queue base on selected filters |
|
4 |
% Of Active Cases with a Schedule Date |
% Of Active Cases with a Schedule Date in the Active Queue |
|
5 |
Average Booking Turnaround Time |
Avg # of days between the Order Received Date and Appointment Created Date. |