Understanding Your Active Queue
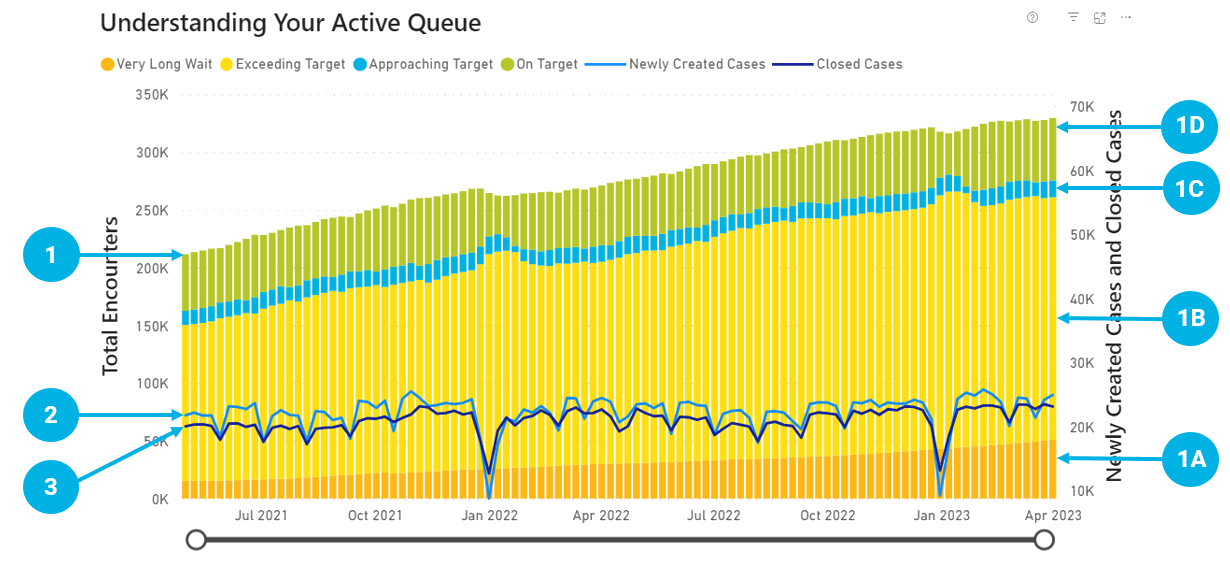
The Horizontal axis represents the selected Time Range; The Active Case axis represents the Volume of Active Cases. Each Bar represents a weekly volume of Active Cases. The graph gives information about all Active Cases by the end of each week, grouped by Target classification within a specified Time Range.
- The result can be filtered by Region, Facilities, Wait 2 Priority Levels, and Service Area(s).
- Each week starts on Sunday at 12:00am and finishes on Saturday at 11:59pm.
- This visual will interact/filter all other visuals on the page.

Understanding Your Active Queue – Data Points
|
Data Point |
Definition |
Methodology |
|
1 |
Bar Height represents the volume of Cases with an Open Status, Grouped by Wait 2 Target Classification |
The volume of Cases with an Open status by the end of the single week (Open Queue) |
|
1A |
Bar segment represents the volume of Cases with an Open Status with Very Long Waits |
The volume of Cases with an Open Status for a single week with the Wait 2 Time days >= Very Long Wait Threshold |
|
1B |
Bar segment represents the volume of Cases with an Open Status with Wait 2 days Exceeding Wait 2 Access Target |
The volume of Cases with an Open Status for a single week with the Wait 2 Time days > Wait 2 Access Target and < Very Long Wait Threshold |
|
1C |
Bar segment represents the volume of Cases with an Open Status Approaching Target |
The volume of Cases with an Open Status for a single week with the Wait 2 Time days < Wait 2 Access Target and > = Access Target Warning Days |
|
1D |
Bar segment represents a volume of Cases with an Open Status within Target |
The volume of Cases with an Open Status for a single week with the Wait 2 Time days < (Wait 2 Time Target – Access Target Warning days) |
|
2 |
Volume Newly Created Cased for the single week |
Weekly Volume of Cases Opened within selected Time Range where Decision to Treat Date is within the specific week. The volume of Cases closed with the Data Entry Error and Excluded from Reports should be removed from the Open cases as well |
|
3 |
Volume Cases closed on the single week |
The volume of Cases Closed within selected Time Range (Closed with Procedure Date and Procedure No Longer Required based on the date when Procedure No Longer Required reason is provided) If Case is closed with Data Entry Error, the case will not be shown in the report |
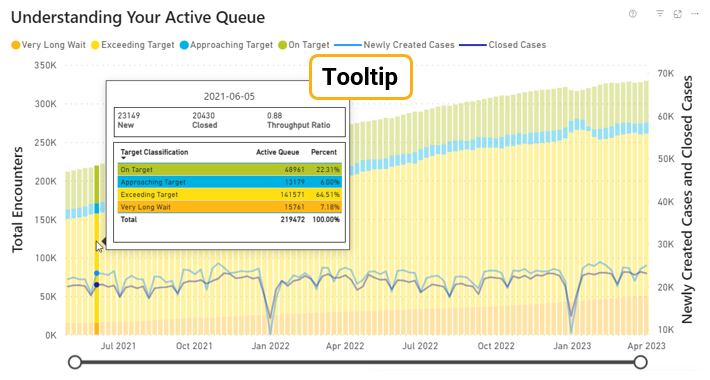
Note: Tooltips will be presented when the user navigates to the specific data point.
